For years know I have been interested in the topic of music visualization. What often disappointed me in the reactive visualizers I saw was the lack of organic reactivity. What we, as human, perceive in music cannot be transcribed by the frequency data only, and often you will encounter visualizers which react to the frequency domain of the signal, but miss the energy we feel when listening to the sound. In this article I will talk and demonstrate about this issue and break down a possible solution to the problem.
The solution I will describe is by far the easiest to implement and outputs decent results. However more effective techniques exist, they will get covered in other articles in a near future.
Examples to illustrate the issue I am tackling
In this section I will try to explain what I mean by «a lack of organic reactivity». I am not mocking the author’s work – don’t get me wrong. I am just using those examples to prove a point. Maybe this was intended by the artist, maybe not, we don’t care here: the goal is to extend our knowledge 🙂
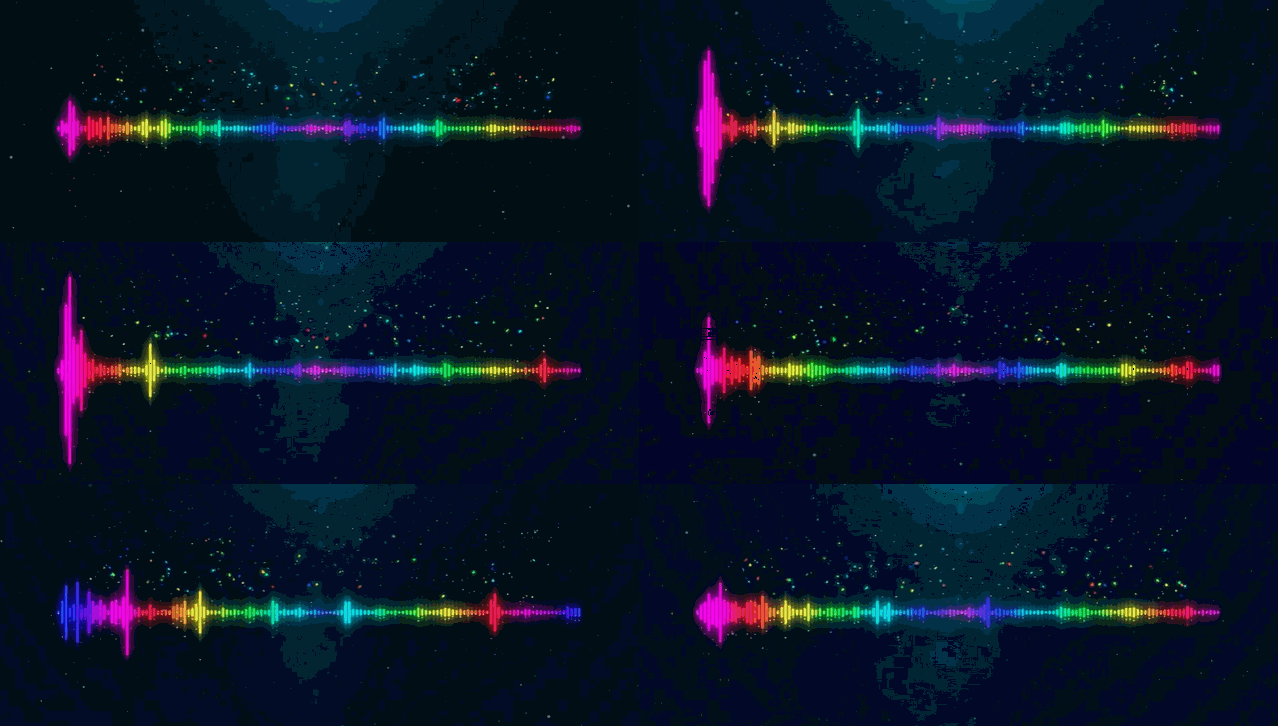
This is a typical frequency data visualizer, where the amplitude of each frequency band is linked to the height of a rectangle. We all have seen those at least ten times in our existence, and there is a reason for that: this can be created very easily. However, if we can feel the reactivity when variations in the audio are easily perceptible in the signal, it tends to become a real mess as soon as a lot of instruments play in a larger frequency range, after the music drops let’s say. If the issue still isn’t clear to you, watch the first minute of this video:
At the beginning, and because the audio fluctuates between silent and less silent moments, the signal thus the visualizer transcribes the feeling of the music. However, at 0:42, the rectangles start to wiggle in a way that doesn’t really describes the music. As humans, we can feel the music, we can tap the tempo, headbang to the beat because we can distinguish the kick and the snare from the rest of the audio. And also because we have some kind of perception of a rythme, a cultural background, maybe some knowledge about music – but this could be the topic of a book itself. However, while the raw frequency domain data itself does not provide enough informations so that such a feeling can emerge from the visuals, some operations can be computed to extract better variations from an input signal.
The energy of a signal
In the next demonstrations, I will be using a 20s audio extract from a music, All Mine by Regal. Check him out !
The same extract is going to be used for a better comparaison between each demonstration.
First, let’s visualize the signal by mapping the frequency domain, divided into 512 samples, to the height of 128 rectangles.
Even though the beat is somehow perceptible when the music drops, it isn’t clear enough. We would like to get a better visual feedback of such a beat, sort of an impact when the kick hits. In its article on gamedev [2], Frédéric Patin makes the following statement:
The human listening system determines the rhythm of music by detecting a pseudo – periodical succession of beats. The signal which is intercepted by the ear contains a certain energy, this energy is converted into an electrical signal which the brain interprets. Obviously, The more energy the sound transports, the louder the sound will seem. But a sound will be heard as a beat only if his energy is largely superior to the sound’s energy history, that is to say if the brain detects a brutal variation in sound energy. Therefore if the ear intercepts a monotonous sound with sometimes big energy peaks it will detect beats, however, if you play a continuous loud sound you will not perceive any beats. Thus, the beats are big variations of sound energy.
His statement seems logical, therefore we will explore his solution step by step and see how it performs. Please note that my implementation is slightly different from his, because in our case we are working with preprocessed data. We will also try to find improvements to fit our use case: music visualization.
Using the frequency data, we can compute the average of frequencies, so called energy ![]() of the signal, using the following formula:
of the signal, using the following formula:
![Rendered by QuickLaTeX.com \[ E = \frac{1}{N} \cdot \sum_{i=0}^{N-1} FFT(i)}\]](https://ciphrd.com/wp-content/ql-cache/quicklatex.com-c28bd5329c185cbfdc3ae8877534056f_l3.png)
where ![]() the number of frequency samples
the number of frequency samples![]() a function which returns the frequency amplitude at index
a function which returns the frequency amplitude at index ![]()
We now have a single value that already gives a better feedback of how we perceive the energy from the audio. We are now going to compute the local energy average ![]() . To do so, we need to keep a track of the computed energies in an history
. To do so, we need to keep a track of the computed energies in an history ![]() of size
of size ![]() .
.
![]()
At each new frame, the history needs to be shifted by one value to the right, and the history first value set to ![]() . The history average
. The history average ![]() can then be computed:
can then be computed:
![Rendered by QuickLaTeX.com \[ E_{avg} = \frac{1}{s} \cdot \sum_{i=0}^{s-1} H[i]}\]](https://ciphrd.com/wp-content/ql-cache/quicklatex.com-df135b6ff3c89b0ef1a635a875e91277_l3.png)
Figure 5 illustrates the relation between the energy and the history average. When an abrupt variation is heard in the music, the energy becomes way higher than the history average. A simple graphical analysis can even give us an approximation on where those peaks should be.
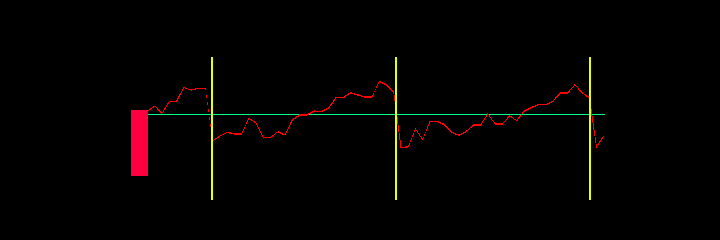
Please note this is an approximation because the history average value changes over time while only the current value is displayed.
Peak detection by comparing the moment energy to the average
By looking at the graph we can already see the correlation between the presence of a peak, the history average ![]() and the moment energy
and the moment energy ![]() . A peak will be detected if the following equation can be verified:
. A peak will be detected if the following equation can be verified:
![Rendered by QuickLaTeX.com \[ \frac{E}{E_{avg}} - C > 0 \]](https://ciphrd.com/wp-content/ql-cache/quicklatex.com-1feabf84f387015327008c3782fb7adc_l3.png)
Where ![]() is the threshold which determines the sensitiveness of a peak. The higher it is, the stronger the amplitude difference has to be. In the following example, we compare the effectiveness of the peak detection for different values of
is the threshold which determines the sensitiveness of a peak. The higher it is, the stronger the amplitude difference has to be. In the following example, we compare the effectiveness of the peak detection for different values of ![]() .
.
A quick issue arise: sometimes the threshold seems to be correctly set, but when the dynamics of the music changes, the value we thought was the best becomes inaccurate. If in some cases setting a fixed threshold ![]() can be enough, a more generic solution would provide a way to generate a value for
can be enough, a more generic solution would provide a way to generate a value for ![]() on real time. This can indeed be done by computing the variance
on real time. This can indeed be done by computing the variance ![]() of the energy history.
of the energy history.
![Rendered by QuickLaTeX.com \[ V = \frac{1}{s} \cdot \sum_{i=0}^{s-1} (H[i] - E_{avg})^2\]](https://ciphrd.com/wp-content/ql-cache/quicklatex.com-71be4b9dca1b0749ea9b3d453fe0c4a4_l3.png)
The variance gives us an indication on how marked the beats of the song are. The following figure demonstrates how the threshold evolves against its competitors to give a better estimation on where the peaks should be.
How can this peak detection algorithm be improved for music visualization
We now have a good way to determine whether there is a peak or not. However, in the context of a music visualizer, we would like the peak detection to be less reliant on luck and more «predictable». Also, right now, the peak detection only returns a value between 0 and 1. We will try to fix that aswell. The following figure graphs the peak values computed over time on a small part of the extract we are working with and highlights certain issues:
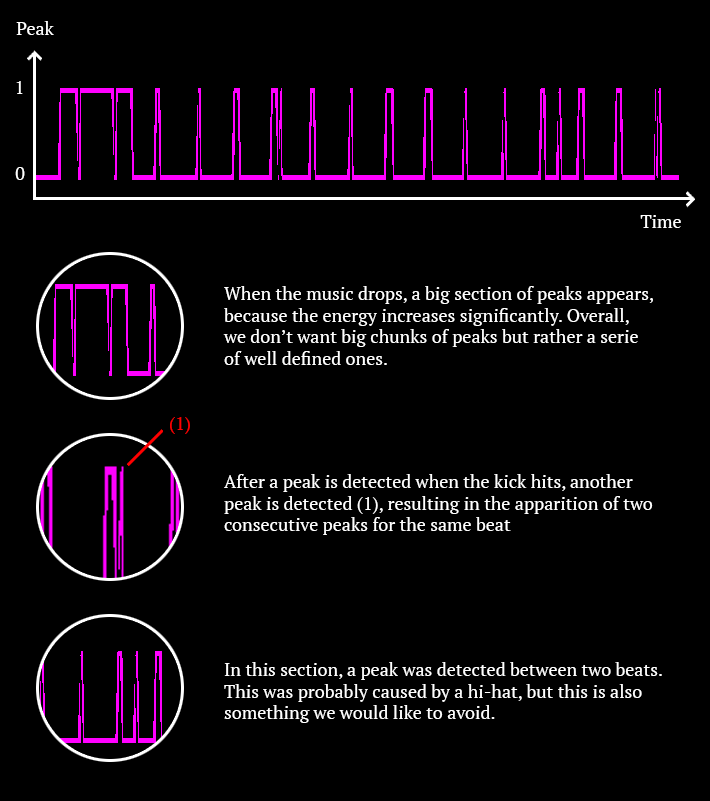
At this point I am diverging from the original article. In his proposal, Frédéric Patin demonstrate how to perform a peak detection for a generic purpose. In the case of music visualizers, the peaks must meet certain criteria so that they can be used properly. I will try to demonstrate how my improvements perform better in such a context.
Let’s try to map this peak value to the scale of circle to see how it interacts with the music. In the next examples we will use the same circle so that we can compare our results.
We can now see why our current peak value can’t be used as it is. The circle reaction is sloppy, jerky and feel unnatural. Let’s list the criteria we need to be able to use our peaks to animate our circle in a way where it reacts properly to the beat:
- our peak values can’t be binary, they have to decrease right after a peak is detected so we can map its value to a property of our visualizer while avoiding flickering
- inconsistencies (Figure 9, (1)) must be avoided, we don’t want our visualizers to glitch unless it was intended
- off-beat peaks shouldn’t be detected
Let’s first draw a graph of what our peaks should look like. We’ll use it as a starting point to think about the possible solutions.
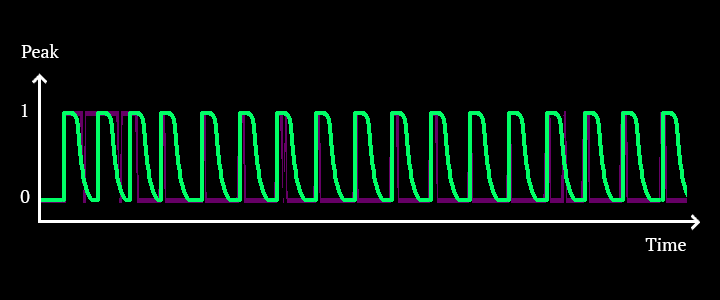
We will first try to avoid the inconsistencies. One way to do that is to prevent the peaks from being detected for a short period of time after one has already been detected. Such a timer can be set manually. We know that BPM (beats per minute) are usually between 80 and 160. By taking the highest value, we can be sure that we won’t miss any peak hitting on the beats while preventing glitches observed in the previous analysis. 160 BPM translates into a beat every 0.375 second. By preventing peaks from being detected 0.375s after one has been detected, we can be sure that beats from musics under 160 BPM won’t be missed.
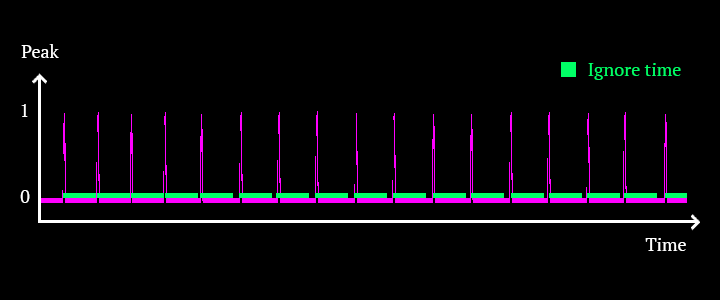
We now have a more predictable and accurate distribution of the peaks over time. However, if we know when a peak starts, the value is still too abrupt to be interpreted by a visualizer as it is:
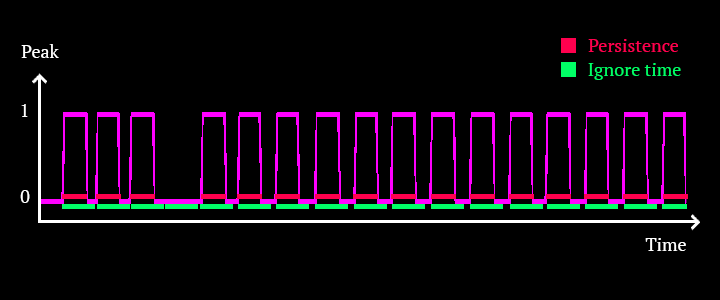
We will now define the peak persistence. This value correspond to the time during which the peak will stay alive. This value must always be lesser than the ignore time, otherwise a peak could be detected while the previous one is still alive. Another approach could be taken, but this is the one I have chosen. Let’s set the persistence to a value of 0.25 seconds. Once a peak is detected, we will keep its timer stored and return a value of 1 until its persistence is over.
Let’s now diverge from this binary representation of a peak. The last step for our peaks to look like the graph we want is to map the value which currently stays at 1. We can do this by using a cubic in-out easing function. Because we know when the peak has started and how long it lasts, we can compute a linear value that goes from 1 to 0 using the following formula:
![Rendered by QuickLaTeX.com \[ {Peak} = 1 - \frac{t - t_{start}}{persistence}\]](https://ciphrd.com/wp-content/ql-cache/quicklatex.com-d50032049e65ecf558c95c9a962cbdc5_l3.png)
where

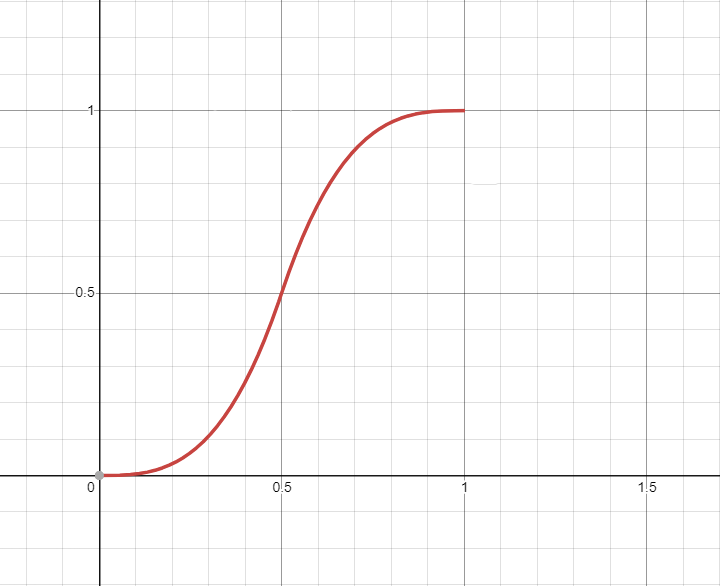
Now that we have a value that goes from 1 to 0 progressively, we can plot this value to the easing function. The cubic in out easing function can be defined as following:
if ![]() :
:
![]()
if
![]()
This is what the function looks like when it is graphed:
Now we apply this function to the peak value:
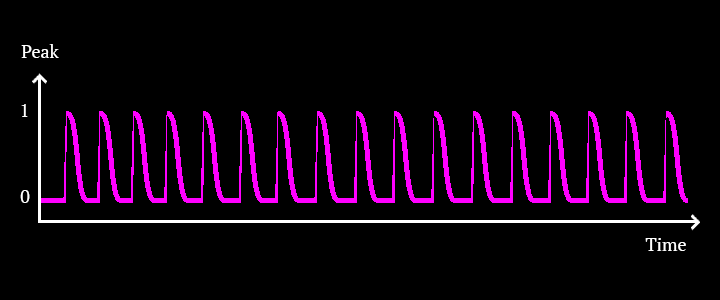
When we apply this result to the circle we’ve been working with:
We have reached the end of this article. In the next chapter, I will cover how it is more judicious to perform the peak detection not on all the frequencies but on specific frequency bands. This will allow us to isolate the low frequencies from the mid and the high ones. We will also cover a faster technique that performs better while being much simpler.
Follow me on instagram for more contentReferences
- Time Domain vs. Frequency Domain of Audio Signals, Learning about Electronics
- Beat Detection Algorithms, Frédéric Patin
- Beat Detection – The Scientific View, Mario Zechner
- Onset detection revisited, Simon Dixon
- Beat detection algorithm, Parallel cube
- Fast Fourier Transform, Wikipedia
- Algorithmic Beat Mapping in Unity: Real-time Audio Analysis Using the Unity API, Jesse, Giant Com
Great work. I’m curious if you have part 2 on the way? Ive just picked up a sound shield from sparkfun and plan to try implementing these ideas in a visualizer this fall. Looking forward to trying some of the principles you outline out!
Hello !
Unfortunately, the part 2 is not scheduled for a near future. Since I moved my workflow to Touch Designer, their audio analysis module is sufficient and outperforms the method I describe here (well not on all the aspects but their module is perfect for audio visualization).
I don’t even remember the idea with enough detail to quickly describe it to you :/
Sorry